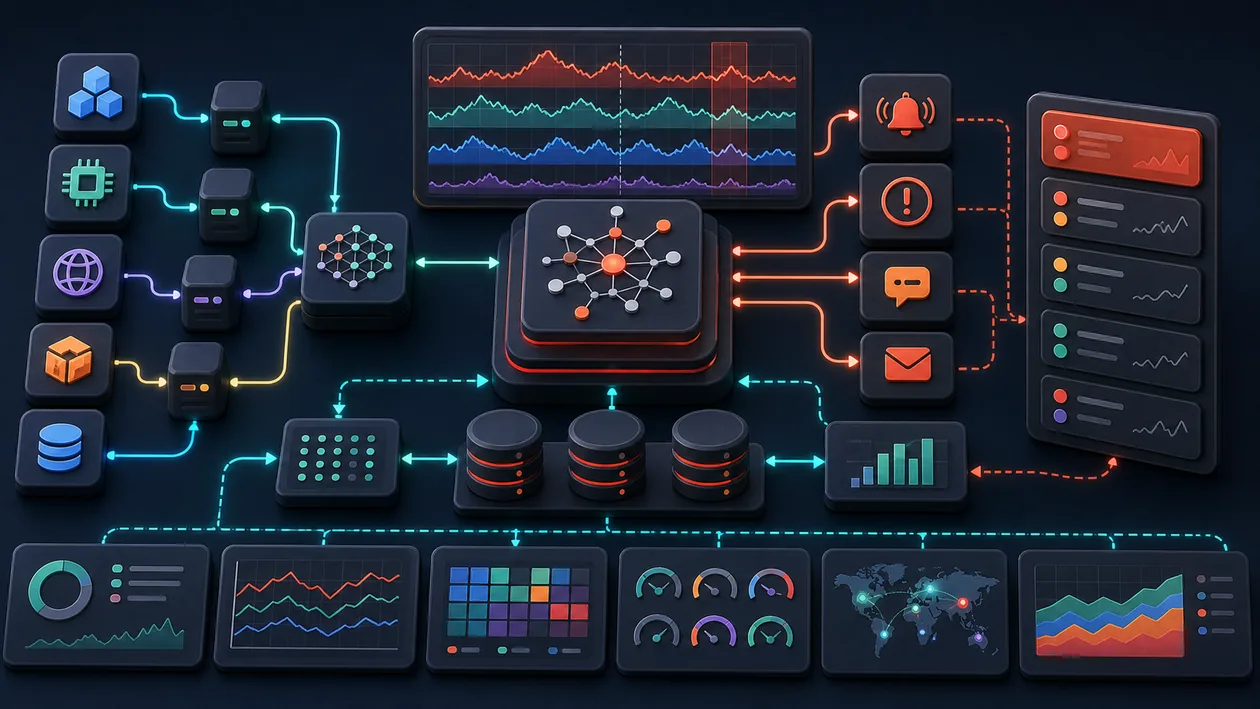
Prometheus is an open-source metrics and monitoring system, not an AI assistant or workflow automator. It collects timestamped measurements, stores them as time series, and supports querying and alerting. Common signals include request rate, error rate, latency, resource consumption, and queue depth.
Who is Prometheus for?
Prometheus suits teams operating services, containers, or infrastructure and wanting to turn technical signals into useful observability. It works particularly well with a pull-based exporter landscape and complements visualisation through Grafana. Log search and distributed traces require additional systems; metrics alone do not explain every incident.
Start with a few SLO signals
Begin from the user perspective: availability, error rate, and latency of one critical journey. A wall of CPU charts helps little if no one knows whether customers are affected. Define an owner, urgency, runbook, and concrete action for each alert.
Labels and cardinality
Labels make metrics filterable, but can make storage and query cost explode. IDs, email addresses, full URLs, or random request values do not belong as Prometheus labels. Use a few bounded dimensions such as service, endpoint class, or status family, and review new metrics.
Queries, recording rules, and alerting
PromQL supports flexible queries; frequent or expensive calculations can be prepared as recording rules. Alerts should represent symptoms and duration, not every short fluctuation. Alertmanager routing, deduplication, and inhibition keep one outage from creating twenty pages. Test rules using deliberately generated failure conditions.
Operations and retention
Plan scrape interval, retention, storage, backups, and high availability around expected load. Prometheus is not an unlimited long-term archive; remote storage or compatible systems may be needed for larger scale or longer retention. Protect metrics endpoints because they can reveal internal names, capacity, or error detail.
Editorial assessment
Prometheus is an excellent standard for technical metrics when a team takes cardinality, alert hygiene, and operational ownership seriously. The best early result is not a pretty dashboard but an alert that fires rarely, reaches the right person, and speeds a clear diagnosis.
Open frequently asked questions
FAQ
Does Prometheus replace log management?
No. Metrics efficiently show trends and symptoms; detailed events and root causes usually live in logs or traces.
Why are high-cardinality labels dangerous?
Every unique label combination creates a separate time series. Unbounded IDs or URLs can overwhelm storage and queries very quickly.
What makes a good alert?
It describes a relevant, sustained user or system impact, has an owner and a short runbook. Mere fluctuations belong on a dashboard.